Facebook ads benchmarks in 2026
Is your Facebook CTR actually good, or just expensive noise? At Zeely, we pulled the most current 2026 benchmark datasets and turned them into a practical benchmark and optimization playbook for SMBs running Meta ads.
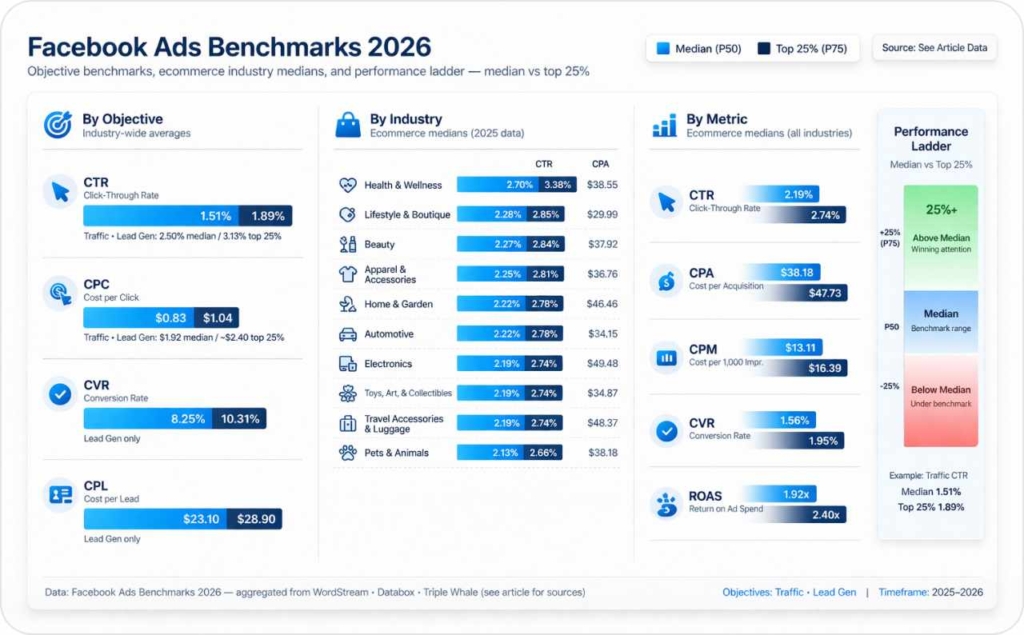
In 2026, average CTR depends on what you measure. WordStream’s roundup lists about 1.51% CTR for Traffic and 2.50% CTR for Lead Gen, with Lead Gen also averaging 8.25% CVR and about $23.10 CPL. Databox’s cross-company benchmarks show a median about 1.81% CTR and 1.03% Link CTR. For ecommerce-heavy accounts, Triple Whale reports a median 2.19% CTR across industries.
Benchmarks aren’t goals, they’re guardrails. In this guide, I’ll show you the most current Facebook ads benchmarks and average CTR for Facebook ads, plus how to read them by objective, industry, creative format, and funnel stage. You’ll leave with a simple diagnose, test, scale plan and a benchmark table you can screenshot.

Facebook ads benchmarks 2026 table: CTR, CPC, CVR, CPL by objective
These are industry-wide averages from large datasets. Your results will vary based on creative, offer, tracking, and landing page quality.
| Meta objective | Avg CTR | Avg CPC | Avg CVR | Avg CPL |
| Traffic | 1.51% | $0.83 | varies by site | not applicable |
| Lead Gen | 2.50% | $1.92 | 8.25% | $23.10 |
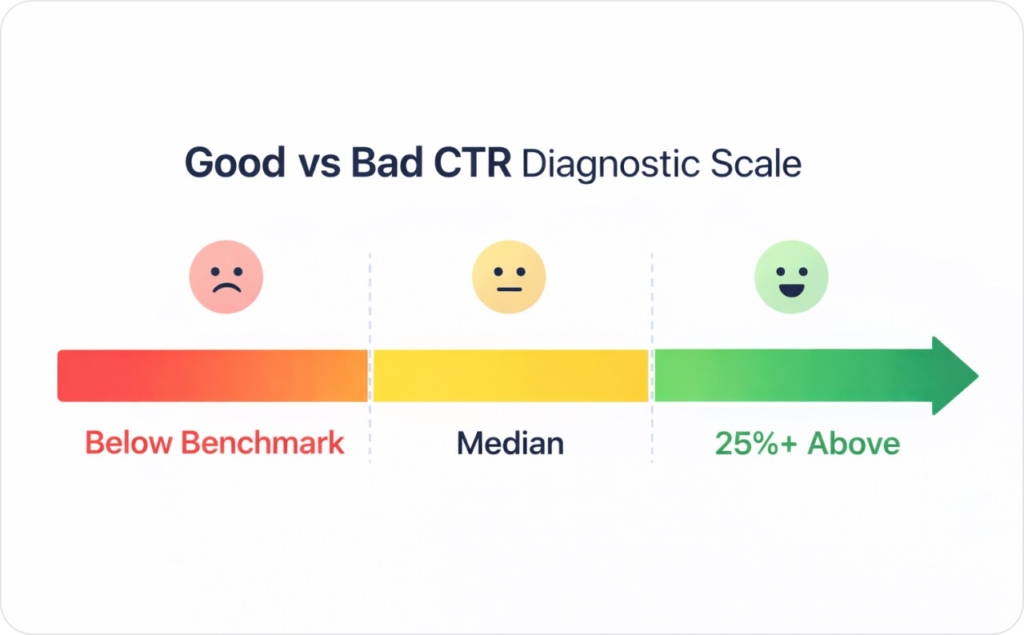
Quick “good vs bad” rule for CTR by objective
Use this as a fast read, not a KPI tattoo.
- Below median: under the benchmark CTR for your objective
- At median: roughly in the benchmark range
- 25%+ above median: you’re winning attention
Example: Traffic median is 1.51%, so 25% above is about 1.89%. Lead Gen median is 2.50%, so 25% above is about 3.13%.
One warning I want you to remember: CTR up does not automatically mean revenue up. I’ll show you how to sanity-check that later.
How to use this table (so it doesn’t mislead you)
Two rules keep benchmarks honest:
- Compare only to the same objective. Traffic and Leads behave differently by design. Sales is even more variable, because purchase intent and price points swing results hard.
- Compare only to the same CTR metric. If you’re looking at Link CTR but benchmarking against CTR (All), you’ll think you’re “underperforming” when you’re not.
Facebook ads benchmarks by industry: ecommerce CTR, CPA, CPM, CVR, ROAS
This section is for ecommerce-heavy accounts and multi-brand cohorts. Triple Whale’s dataset covers nearly 35,000 brands and reports year-long benchmarks (Jan 1 to Dec 31, 2025), updated Feb 25, 2026.
Here’s the table you can screenshot, then use to set realistic ranges.
| E-commerce industry | Median CTR | Median CPA | Median CPM | Median CVR | Median ROAS |
| Apparel & Accessories | 2.25% | $36.76 | $12.27 | 1.46% | 2.18 |
| Beauty | 2.27% | $37.92 | $18.02 | 1.94% | 1.57 |
| Home & Garden | 2.22% | $46.46 | $14.29 | 1.32% | 2.18 |
| Food & Beverage | 1.85% | $38.15 | $15.25 | 2.02% | 1.56 |
| Health & Wellness | 2.70% | $38.55 | $20.70 | 1.72% | 1.50 |
| Sports & Outdoors | 1.91% | $43.89 | $11.40 | 1.28% | 2.28 |
| Toys, Art, & Collectibles | 2.19% | $34.87 | $11.67 | 1.52% | 1.93 |
| Pets & Animals | 2.13% | $38.18 | $15.45 | 1.80% | 1.58 |
| Electronics | 2.19% | $49.48 | $13.89 | 1.20% | 1.92 |
| Lifestyle & Boutique | 2.28% | $29.99 | $13.00 | 1.74% | 1.93 |
| Baby | 1.91% | $30.04 | $11.55 | 1.85% | 2.17 |
| Automotive | 2.22% | $34.15 | $10.01 | 1.30% | 2.54 |
| Books & Music | 2.34% | $30.25 | $11.99 | 1.72% | 1.65 |
| Media & Publishing | 2.21% | $33.78 | $13.11 | 1.56% | 1.17 |
| Travel Accessories & Luggage | 2.19% | $48.37 | $15.83 | 1.29% | 2.25 |
Sources: CTR/CPA/CVR/ROAS tables from Triple Whale (updated Feb 25, 2026). CPM medians from Triple Whale’s “Meta CPM by Industry, 2025” chart.
One quick note on median vs mean:
Most benchmark reports use median because ad performance is lopsided. A few huge spenders or a few wildly bad campaigns can pull the mean up or down. Median is the middle of the pack, so it’s usually the safer guardrail.
Why your industry wins or loses on CTR
When CTR is high in one category and low in another, I usually see four drivers:
- Creative density: crowded categories force better hooks and fresher angles
- Price point: high AOV often needs more proof before clicks
- Offer clarity: “what do I get, today” beats vague branding
- Repeat purchase behavior: habitual buys click faster than one-time decisions
Health & Wellness is a great example: strong CTR, but also high CPM pressure, meaning it’s competitive to reach people.
Industry benchmark interpretation: CTR + CVR together
CTR without CVR is a half-story.
- High CTR, weak CVR: your ad promise and landing page reality don’t match, or the page has friction (slow load, unclear next step).
- Lower CTR, strong CVR: fewer clicks, better intent. This can still win on CPA and ROAS.
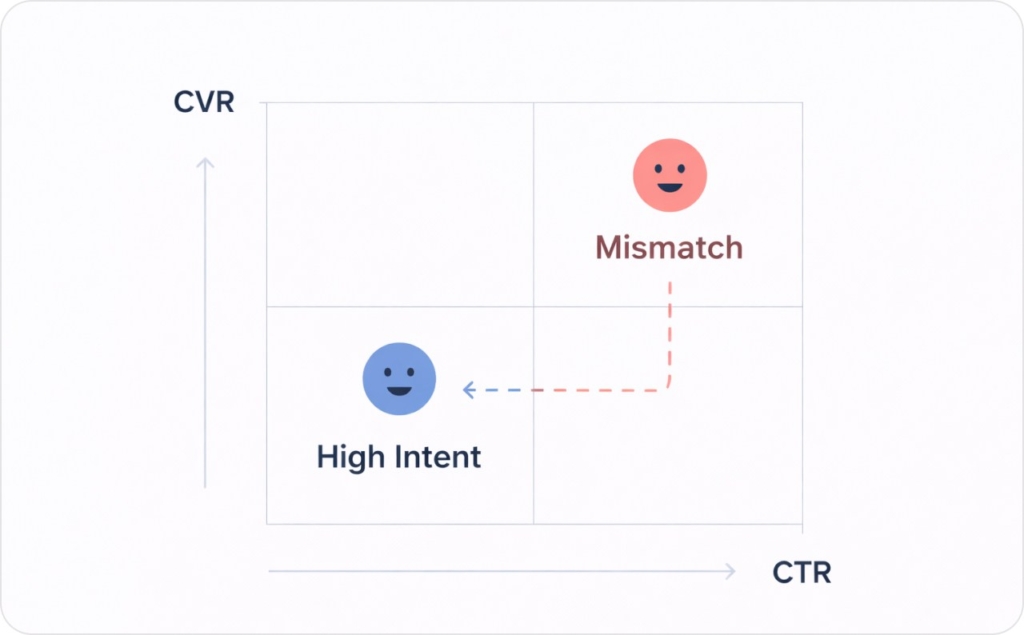
Triple Whale calls out this exact pattern with Travel Accessories & Luggage: CTR rose while CVR fell, which is a classic post-click friction warning.
What is a good CTR for Facebook ads in 2026: choose the right CTR metric
If you only remember one thing, make it this: CTR is not one number.
Mini glossary (the four numbers you’ll see daily)
- CTR (All): percent of impressions that produced any click (including expands, profile taps, etc.).
- Link CTR: percent of impressions that produced a link click to a destination.
- CPC (All): cost per any click event.
- CPM: cost per 1,000 impressions (cost to reach).
- Frequency: average times the same person saw your ad (fatigue signal).
If your goal is website traffic, Link CTR is usually the cleaner KPI. CTR (All) is still useful, but it can inflate when people click things that are not your link.
What’s the average CTR on Facebook ads?
Databox aggregates anonymized benchmark data and shows a median CTR (All) of about 1.81% and a median Link CTR of about 1.03%, last updated March 02, 2026. Read now a detailed article about the average CTR for Facebook ads.
Here’s the “benchmark ladder” I use for fast diagnosis (Databox quartiles):
| Metric | Bottom 25% | Median | Top 25% |
| CTR (All) | 1.13% | 1.81% | 3.09% |
| Link CTR | 0.65% | 1.03% | 1.90% |
| CPC (All) | $0.17 | $0.36 | $0.71 |
| Frequency | 2.21 | 3.01 | 4.39 |
Source: Databox Facebook Ads benchmarks (updated Mar 02, 2026).
Why benchmark reports disagree
If you’ve ever compared two reports and felt personally betrayed, you’re not alone.
Benchmark gaps usually come from:
- Different cohorts (SMBs vs enterprise, ecommerce-heavy vs mixed)
- Different placements (Feed-heavy accounts vs Reels-heavy)
- Different objectives (Traffic vs Leads vs Sales)
- Different CTR definitions (CTR All vs Link CTR)
- Different attribution and tracking setups (which changes what “good” looks like)
That’s why I treat benchmarks as guardrails, then I validate everything against CPA, lead quality, and ROAS.
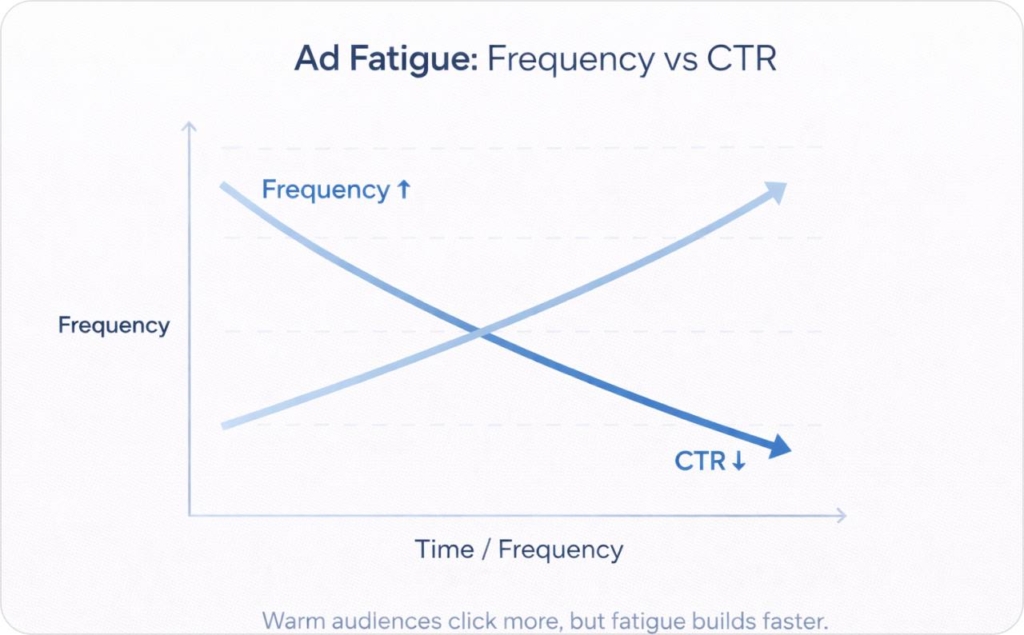
The “CTR + Frequency” fatigue trigger
Here’s my fatigue baseline: Databox shows a median frequency around 3.01.
A simple trigger you can use:
- If frequency climbs week-over-week and CTR falls, rotate creative first.
- Do not “fix” this by slicing audiences thinner until delivery breaks.
Most of the time, it’s not your targeting. It’s that your hook got old.
Facebook advertising CTR benchmarks by ad format: why video-first changes expectations
In 2026, format mix is part of benchmarking. Video is everywhere for a reason: Wyzowl reports video is used by 91% of businesses, and 93% of marketers consider it integral to their marketing.
Here’s how CTR typically behaves by format (directional, not absolute):
- Static: can win on clarity and speed. Strong for direct offers and retargeting.
- Carousel: can raise CTR when you have multiple benefits or a catalog story.
- Short-form vertical video (9:16): often wins attention fast, but click behavior depends on how well you qualify the viewer.
Format-to-objective mapping (when clicks are the point)
- Traffic: Link CTR is your north star. Static and simple video often beat “cinema.”
- Lead Gen: CTR matters, but form completion and lead quality matter more.
- Sales: you can see lower CTR with higher purchase intent. Don’t panic if CPA is improving.
Three creative examples (Hook + Proof + CTA)
- Static (Traffic)
Hook: “Cut checkout time to 30 seconds.”
Proof: “4.8 stars from 12,400 buyers.”
CTA: “See it in action.”

2. Vertical video (Lead Gen)
Hook: “If you’re still guessing your ad budget, stop.”
Proof: “Free 7-minute calculator.”
CTA: “Get the template.”
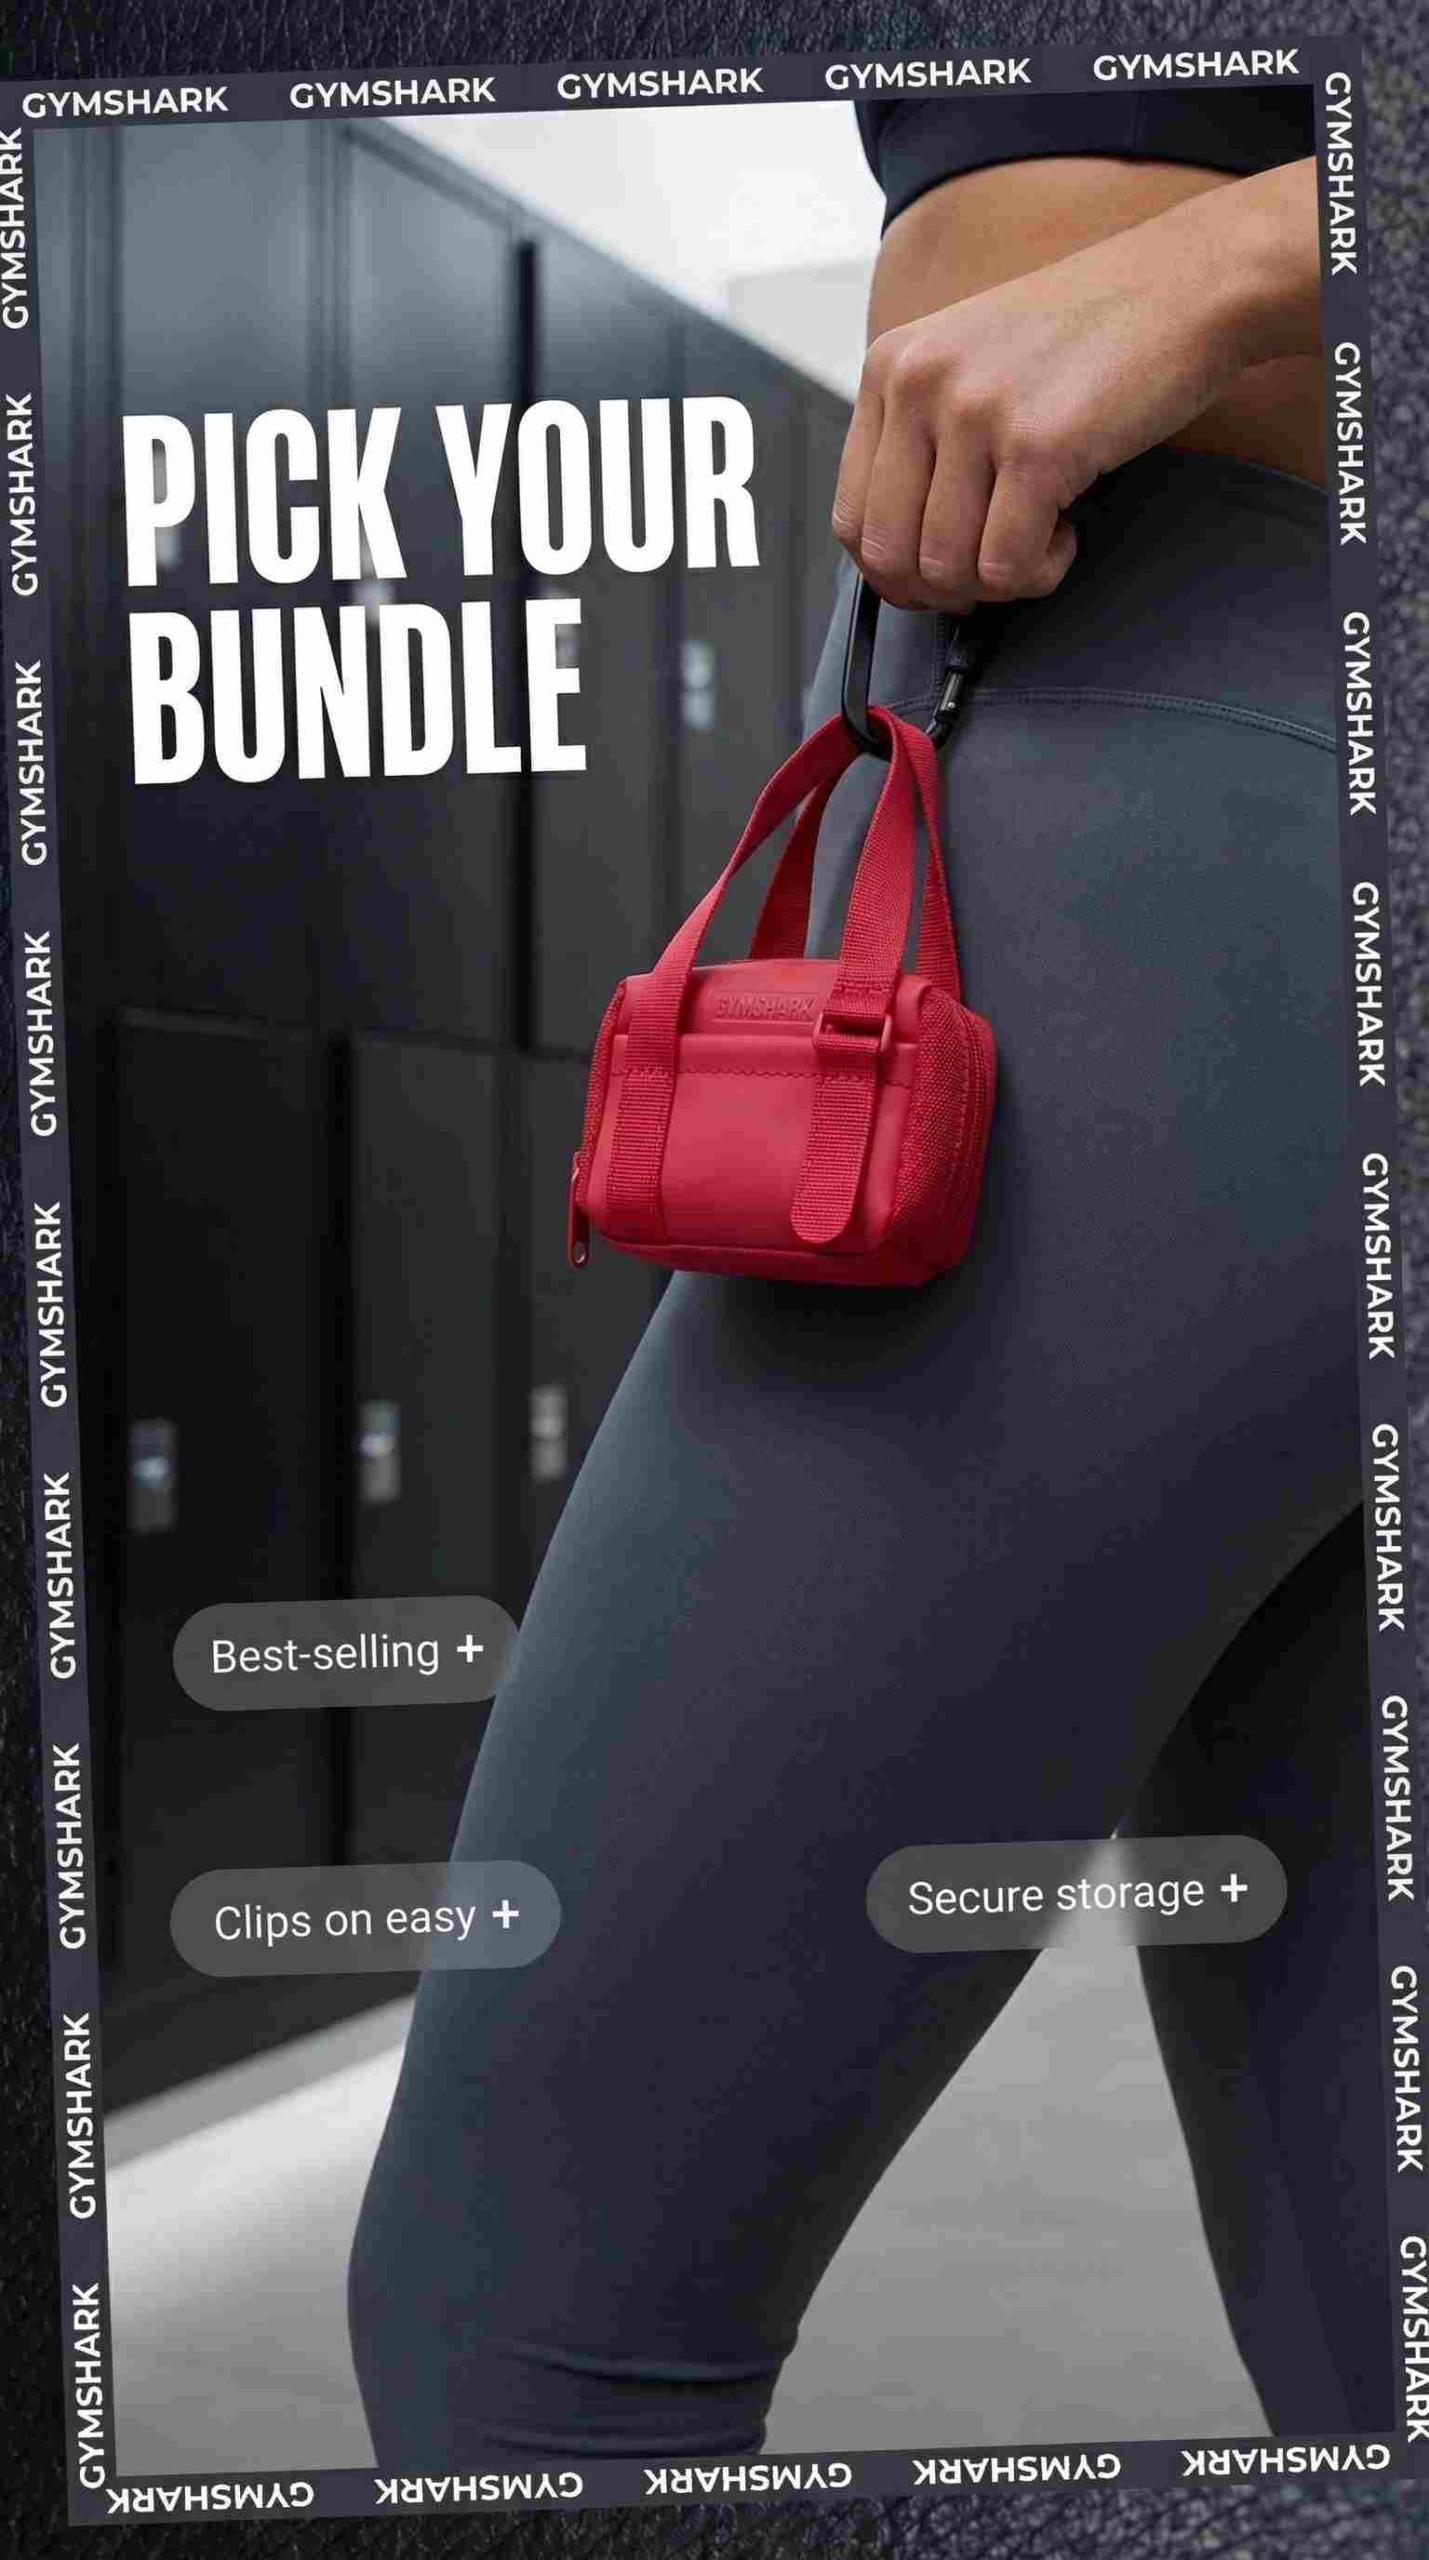
3. Carousel (Sales)
Hook: “Pick your bundle.”
Proof: “Best-sellers, then reviews on card 2.”
CTA: “Shop bundles.”
You may also like to read an article about 20 efficient Facebook carousel ad examples.


Use Zeely AI creative generator to create stunning carousels, static ads, and realistic UGC-style videos.
Format cheat-sheet: what to test first
Static (3 tests)
- Rewrite the first line to a single specific benefit
- Swap proof type: review count vs guarantee vs price anchor
- Tighten CTA: one verb, one next step
Video (3 tests)
- New first frame: result first, not logo first
- Add proof by second 2: number, demo, or testimonial clip
- Change offer framing: “save $X” vs “get X free”
Carousel (2 tests)
- Card order: proof earlier vs product earlier
- Add a “comparison” card: option A vs option B
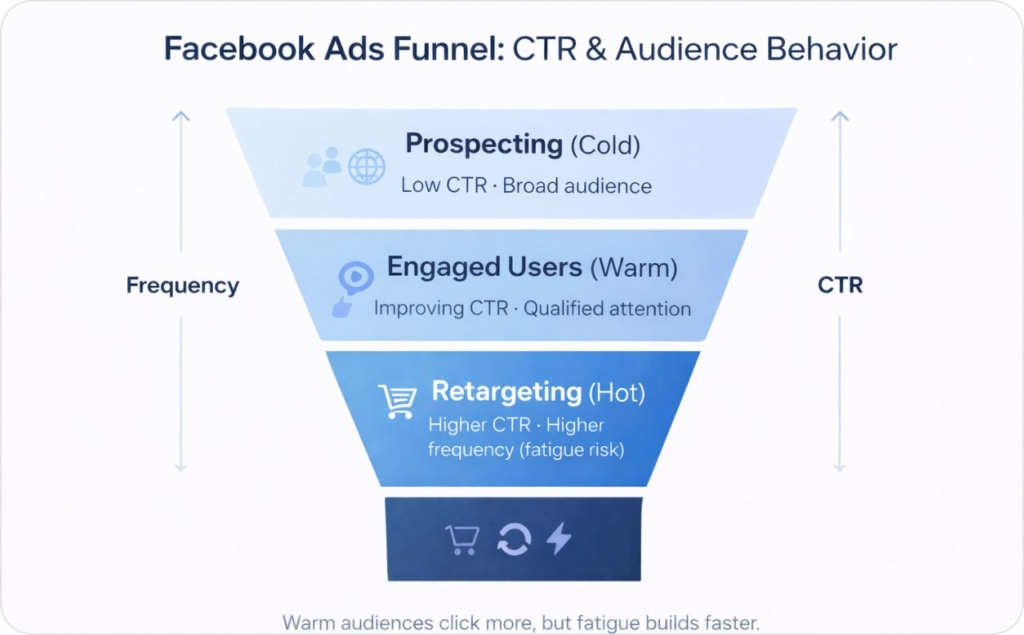
Facebook click-through rates by funnel stage: cold vs warm (and why relevance beats micro-targeting)
Cold audiences usually have lower CTR than warm audiences. That’s normal. Warm audiences also burn out faster, because frequency climbs.
Here’s a segmentation template you can copy:
- Prospecting: broad or interest-based, lookalikes, Advantage+ audiences
- Engaged viewers: video watchers, Instagram engagers
- Site visitors: last 30, 14, 7 days
- Cart abandoners: high intent, short windows
- Past purchasers: upsell, cross-sell, replenishment
A simple framework I use:
- If cold CTR is low: fix the hook and first frame first
- If warm CTR is low: fix the offer, urgency, or proof first
Why I push “relevance” so hard: Nielsen reports 67% of Black audiences surveyed pay more attention to ads that reflect their culture. That’s not a targeting trick. That’s a creative relevance lever.
Cold CTR diagnosis tree
When prospecting CTR dips, I check four buckets:
- Hook mismatch: benefit is vague, or you lead with features
- Audience mismatch: message is right, but for the wrong buyer
- Placement mismatch: ad was built for Feed, shown in Reels (or vice versa)
- Ad fatigue: frequency creeping up, CTR drifting down
Most teams change targeting first. I’d rather rotate the hook and keep delivery stable.
How to interpret average click-through rate Facebook ads with business metrics (CTR ≠ ROI)
CTR is a useful signal. It’s not the finish line.
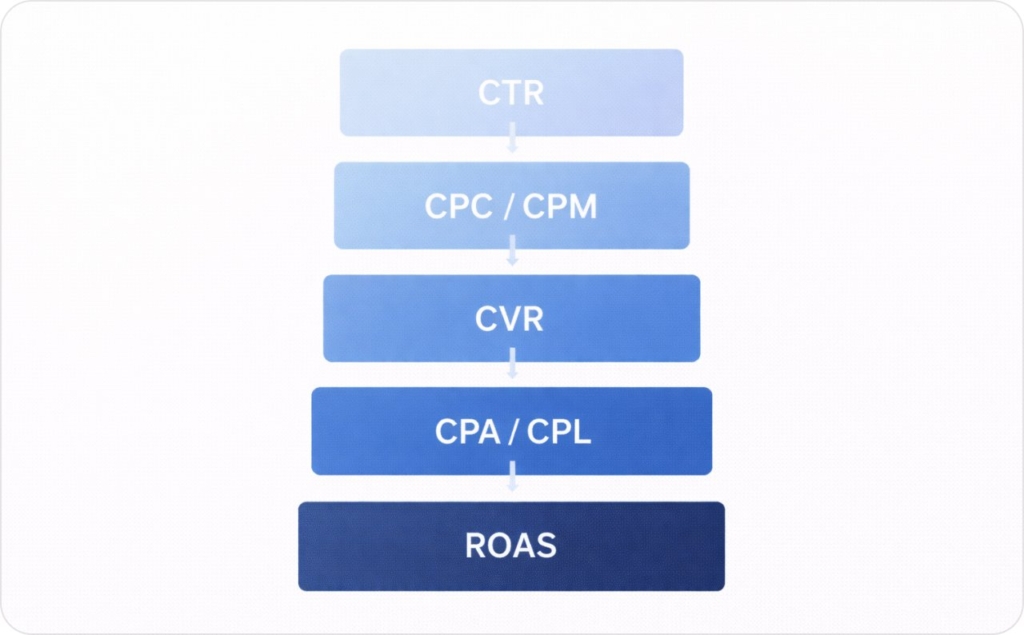
I teach this as a simple CTR stack:
- CTR (does the ad stop thumbs?)
- CPC / CPM (how expensive is attention?)
- Landing page CVR (does the page keep the promise?)
- CPA / CPL (what did the result cost?)
- ROAS (did you make money?)
HubSpot reports 65% of marketers are meeting or exceeding their benchmarks, and the common thread is tracking the right KPIs, not obsessing over one number.
Equation strip (design note for your blog image):
CPA = CPC ÷ CVR
Two real scenarios I see all the time:
- CTR up, CVR down: you bought cheaper curiosity clicks, not buyers. Fix message match and qualification.
- CTR down, CPA down: fewer clicks, better clicks. Don’t “save” it if ROAS is improving.
Measurement hygiene checklist (do this before judging CTR)
- Add UTMs on every ad set (source, medium, campaign, content)
- Confirm event priority and deduplication are stable
- Check landing page speed on mobile
- Compare the same date range and the same CTR metric
The 3 CTR traps (and how to avoid them)
- Optimizing for clicks when you need conversions
Use CTR to diagnose creative, then let conversions decide budget. - Misleading creative
A high CTR that tanks CVR is just fast spend. - Under-measured results
If tracking is broken, you’ll chase the wrong “winner” every week.
Facebook ads benchmarks 2026 in the AI + Advantage+ era: CTR inflation, trust, guardrails
Automation can lift CTR while lowering quality. It happens when delivery expands into placements where people click differently, or when broad matching finds cheap traffic that does not convert.
IAB reports 83% of ad executives say their company has deployed AI in the creative process, and 71% of Gen Z and Millennials believe they’ve seen AI-generated ads. That’s why trust and quality control now sit right next to CTR in your KPI stack.
Guardrails I use with AI-heavy creative iteration:
- Creative QA: human truth check before launch
- Offer accuracy: price, terms, and results claims must match the page
- Lead filters: add qualifying questions or higher intent steps
- Quality events: optimize to deeper actions when possible
- Exclusions: protect retargeting pools from low-intent traffic
Zeely workflow (simple and repeatable)
Generate variations, do a human review, launch, auto-tag angles, then review a weekly scorecard (CTR, Link CTR, CPC, CVR, CPA, ROAS). This keeps speed without letting sloppy creative poison your account.
Quality control checklist for AI creatives
- Human truth check: can the landing page prove every claim?
- Offer accuracy: pricing, shipping, guarantees match exactly
- Before/after caution: avoid unrealistic results
- Compliance basics: disclaimers where needed, no hidden terms
- Message match: ad headline and page headline agree
How to improve click through rate Facebook ads fast: 10 fixes (skimmable)
HubSpot reports about 94% of marketers plan to use AI in content creation in 2026, which means faster iteration is the new normal. The win is doing it with guardrails.
Rewrite, swap, tighten: the 10 CTR fixes
- Rewrite the first line as benefit + specificity
- Swap to one offer and one CTA (no menu of choices)
- Tighten proof into the first seconds (numbers, reviews, guarantee)
- Match ad promise to landing page headline (word-for-word is fine)
- Kill heavy text overlays that hide the core visual
- Refresh creatives before frequency creeps up
- Segment placements so winners don’t fund losers
- Shorten the path from click to value (remove steps)
- Frame mobile-first (9:16 safe zones, large type, single focal point)
- Test three angles per offer (pain, desire, social proof)
Want the full playbook? Read: How to Improve Facebook Ad CTR and discover proven strategies, optimization tips, and practical examples to increase clicks and get more from your ad budget.
FAQ
Most accounts land around 1 to 2% depending on the CTR metric. Traffic often clusters near 1.5%, while lead gen can be closer to 2.5%. Treat benchmarks as guardrails, then validate against CPA and lead quality.
Good means you’re at or above the median for your objective and your cost per result is not getting worse. A high CTR that brings low-quality clicks is just a faster way to spend. Always check CVR, CPL, CPA, and ROAS.
If you sell something, optimize for conversions once tracking is stable. CTR is a diagnostic that tells you if the creative stops thumbs. Use CTR to improve ads, then let conversions decide which ads deserve budget.
CTR (All) counts any click interaction, including expands and profile taps. Link CTR focuses on clicks that actually go to a destination. If your goal is website traffic, Link CTR is usually the cleaner benchmark.
Usually it’s fatigue (frequency rose), creative mismatch (new audience or placement), or auction pressure. Before touching targeting, refresh the first frame, check placement breakdowns, and confirm you’re comparing the same CTR metric. Read an article on how to prevent ad fatigue.
Often, yes, stronger engagement can improve efficiency, but it’s not guaranteed. You can also get cheap clicks that never convert. The real win is lower CPC with stable or improving CVR, which brings CPA or CPL down.
Feeds often drive more deliberate clicks; short-form video placements can drive strong engagement with different click behavior. Don’t guess. Benchmark by placement inside your account, then shift budget toward placements that keep CPA healthy.
Not automatically. A 3% CTR can be great for prospecting, or it can mean your ad is clicky and your landing page can’t deliver. If CVR drops or returns fall, tighten the promise and qualify the click with proof.

Emma blends product marketing and content to turn complex tools into simple, sales-driven playbooks for AI ad creatives and Facebook/Instagram campaigns. You’ll get checklists, bite-size guides, and real results, pulled from thousands of Zeely entrepreneurs, so you can run AI-powered ads confidently, even as a beginner.
Written by: Emma, AI Growth Adviser, Zeely
Reviewed on: March 24, 2026